Every published September sale identified in Fernvale, with the numbers behind each result.
Prepared by Taylah Sherrin · Checked 30 September 2026
4Reported sales
$815,000Median sold price
125Median campaign days
$3.738mTotal sold value
Four homes, four different stories. Sale prices ranged from $748,000 to $1.36 million. A reduced asking price does not always mean a sale below the original guide, as Parkwood’s result shows.
Showing 4 sales
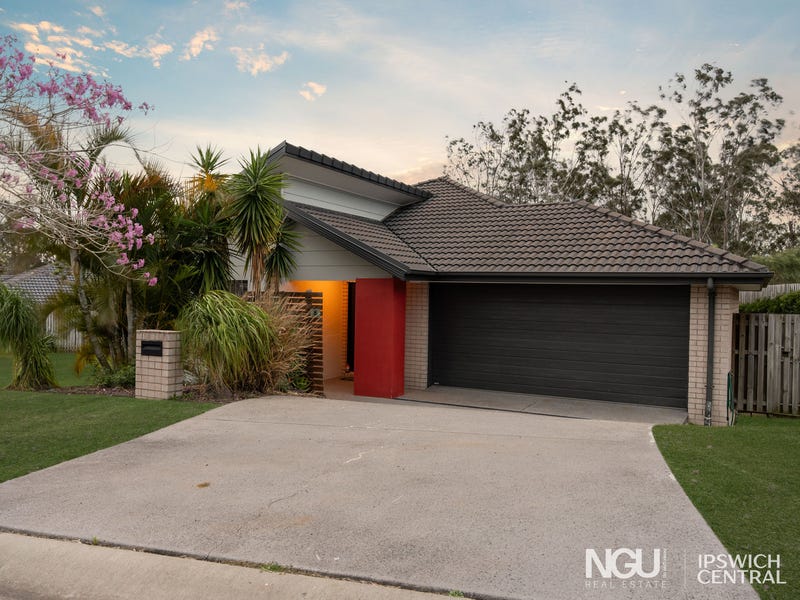
SOLD 25 SEPTEMBER 2026
8 Parkwood Street
Fernvale QLD 4306
Sold price$780,000
40Days on market
1 recordedAdvertised price drops
$1,000 abovethe original $779,000 offers-over threshold
See the price history
17 Aug 2026Offers over $779,000
8 Sep 2026Offers over $749,000
25 Sep 2026Sold for $780,000
The advertised threshold fell by $30,000 (3.9%). The sale finished $1,000 above the original threshold. An offers-over figure is a starting point, not a fixed asking price.
Campaign history: RP Data, checked 30 September 2026. Repeated unchanged records are omitted.
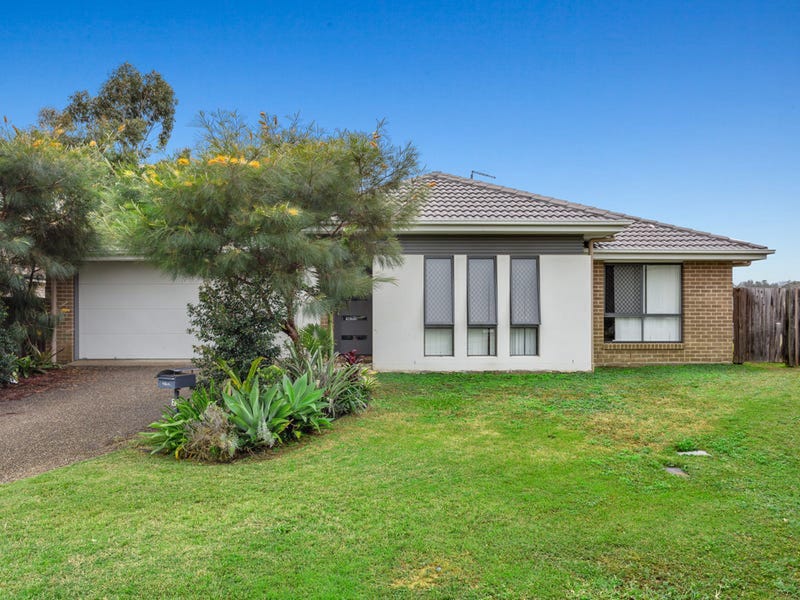
$67,000 belowthe first numeric asking price of $815,000 (8.2%)
See the price history
16 Jan 2026Expressions of interest
3 Feb 2026$815,000
16 Feb 2026Offers over $815,000
19 Feb 2026Offers over $825,000
18 May 2026$799,000
15 Aug 2026$799,000 ONO
16 Aug 2026$775,000
24 Sep 2026Sold for $748,000
Launched without a numeric price. The two recorded reductions were $825,000 to $799,000, then $799,000 to $775,000. The first numeric price to sold difference includes negotiation, not just advertised reductions.
Campaign history: RP Data, checked 30 September 2026. Repeated unchanged records are omitted.
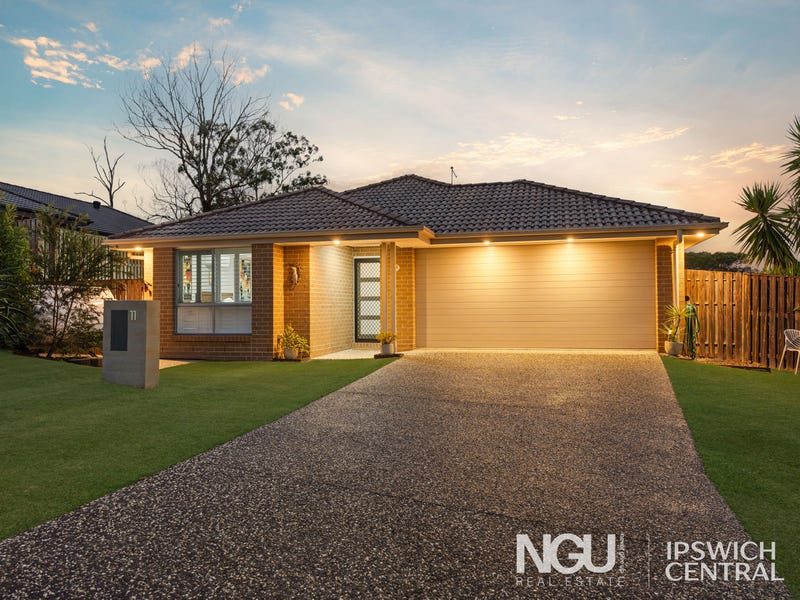
$40,000 belowthe bottom of the original $890,000–$940,000 guide (4.5%)
See the price history
5 May 2026Price guide $890,000 to $940,000
Final recorded guide, date unavailableOffers over $799,000
8 Sep 2026Sold for $850,000
A lower final advertised threshold is recorded, but the available campaign table does not show every dated change. The sold result was $40,000 to $90,000 below the original range and $51,000 above the final offers-over threshold. A complete drop count cannot be confirmed.
Campaign history: RP Data, checked 30 September 2026. Repeated unchanged records are omitted.
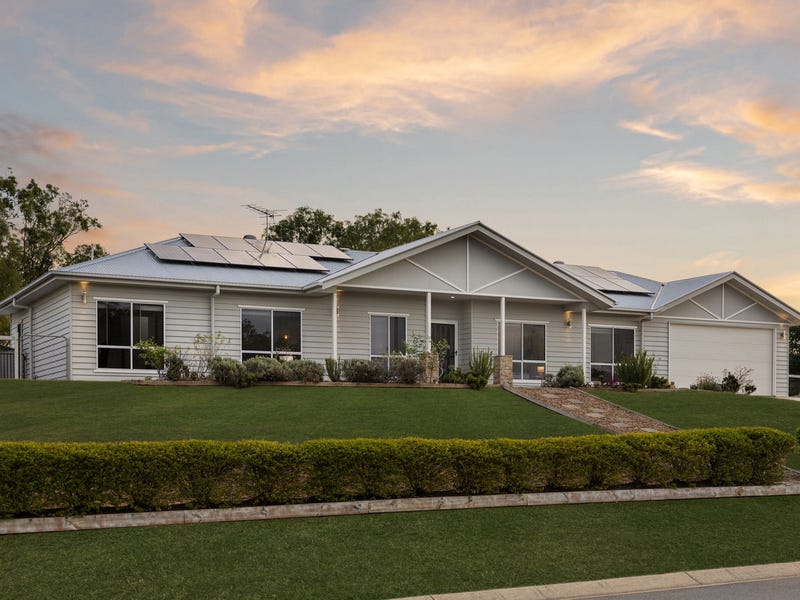
$140,000 belowJanuary’s $1.5 million offers-over threshold (9.3%)
See the price history
24 Jan 2026Offers over $1.5 million
27 Jan 2026First campaign ended
5 May 2026New campaign: For sale
25 May 2026Price guide $1.3 million to $1.4 million
4 Sep 2026Sold for $1,360,000
The lower guide belongs to a separate campaign after the January listing. The sold result sits within May’s $1.3 million to $1.4 million range. The 123 days refers to the May–September campaign, not all elapsed time since January.
Campaign history: RP Data, checked 30 September 2026. Repeated unchanged records are omitted.
No properties match that search. Try another street.
How to read the numbers.
Sold prices and dates come from the realestate.com.au published sold results, cross-checked against RP Data. These are reported sold dates, not settlement dates. All four were marked pending settlement advice in RP Data when checked. Late-reported sales may change the month’s list.
Days on market are RP Data’s recorded campaign days. Separate campaigns can make this different from the time since a home was first advertised.
Advertised drops count distinct downward changes in recorded numeric prices or guide thresholds. Repeated unchanged advertisements, “under contract” labels and non-numeric wording are not drops. Incomplete histories are marked unconfirmed.
Original guide to sold compares the sold price with the first recorded numeric price or guide threshold, with ranges and offers-over wording explained on each card. It includes negotiation and is different from the number of advertised reductions. These four results are not a measure of the whole suburb’s change in value.